Гріга Г.Ю.
The article analyzes the trend of life expectancy in the continents and countries, if has built economic and mathematical model of life expectancy in terms of set problems and on its base it also proposes main direction of improvement indicator of life expectancy.
Key words: life expectancy, child mortality under 5 years, the level of tuberculosis and immunization level.
МОДЕЛЮВАННЯ ОЧІКУВАНОЇ ТРИВАЛОСТІ ЖИТТЯ В РОЗРІЗІ ПРОБЛЕМ ДИТЯЧОЇ СМЕРТНОСТІ ВІКОМ ДО 5 РОКІВ, РІВНЯ ТУБЕРКУЛЬОЗУ ТА РІВНЯ ІМУНІЗАЦІЇ НАСЕЛЕННЯ
У статті проаналізовано тенденцію тривалості життя континентів та країн,, побудовано економіко-математичні моделі тривалості життя в розрізі поставлених проблем та на їх основі запропоновано основні напрямки покращення показника.
Ключові слова: тривалість життя, дитяча смертність віком до 5 років, рівень туберкульозу, рівень імунізації населення.
МОДЕЛИРОВАНИЕ ОЖИДАЕМОЙ ПРОДОЛЖИТЕЛЬНОСТИ ЖИЗНИ В РАЗРЕЗЕ ПРОБЛЕМ ДЕТСКОЙ СМЕРТНОСТИ В ВОЗРАСТЕ ДО 5 ЛЕТ, УРОВНЯ ТУБЕРКУЛЕЗА И УРОВНЯ ИММУНИЗАЦИИ НАСЕЛЕНИЯ
В статье проанализировано тенденции продолжительности жизни континентов и стран, построено экономико-математические модели продолжительности жизни в разрезе поставленных проблем и на их основании предложено основные направления улучшения показателя.
Ключевые слова: продолжительность жизни, детская смертность в возрасте до 5 лет, уровень туберкулеза, уровень иммунизации населения.
Formulation of the problem. Life expectancy is one of the indicators of developed countries, which points to availability of citizens high economic and social conditions. Ensuring the quality of living conditions should be one of the key aspects of the policy of each state. In certain countries, there is a tendency to raise the level of life expectancy, but in the other – the reverse direction. Factors that reduce its impact or continued life expectancy for each country have individual influence. These factors, probably, are the ecological situation, the level of health standards, the ratio of urban and rural population, citizen’s income, the presence of military conflicts and others. Today, actual problem, that can affect the life and with which Ukraine is facing, is the quality of medical care, which generates lack of immunizations, the mortality rate of children under 5 years of age and the incidence of tuberculosis. Therefore, the study is important to determine the effects of various factors on the life expectancy in the context of set issues, and on this basis to identify trends that related to increasing life expectancy.
Analysis of recent research and publications. There is a widespread Lee-Carter model that Ronald Lee and Timothy Miller, and the Federico Gyro Restaurant and Gary King used in his study, used in theirs studies [9]. The study used a time series of age and mortality that is not dependent on time and other parameters. Lee-Carter model reflects the level of mortality (or of life expectancy) and assesses the rate of change of the level for each age group [9]. Another known method is a modified Brass method, which A.I. Stefanovskyi used in his study for the construction of mortality tables in Ukraine [1]. Most studies that exist at present take into account only some countries, as in other countries, including Ukraine, there is no current estimate of the problem.
Objective of the study. The main target of the study is to identify direction that increase life expectancy based on the economic and mathematical models.
Presentation of the main material of the study. The trend of life expectancy traced among global indices. Countries that until today is economically developed, have reached a high level of life expectancy, however, some countries in their development lag behind more than ten years (Figure 1).
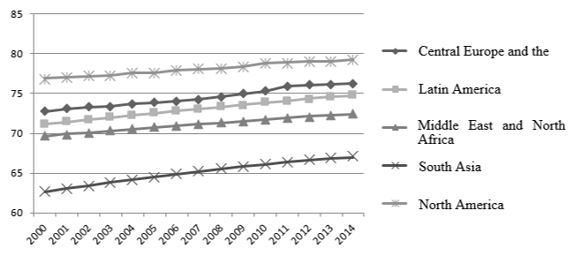
Fig 1. The dynamics of life expectancy in continent for the 2000-2014 years
*Source: developed by the author based on [3]
There is a positive trend of increasing life expectancy during 2000-2014 years in all continents. However, life expectancy is low. Continent that stands out of all is North America. Life expectancy is the highest on the continent, which proved high life expectancy in Canada (Figure 2). However, there are other countries in North America, where life expectancy is lower than in Canada, which reduce overall life expectancy on the continent. The lowest life expectancy is in South Asia, resulting of global issues – food (chronic malnutrition of the population in some countries in the region) and the problem of illiteracy (because of the poverty almost half region’s population is illiterate).
Central Europe is a continent followed by North America. Life expectancy in the most countries is high, but in some countries, such as in Ukraine, life expectancy, in comparison with other countries in the continent, is low.
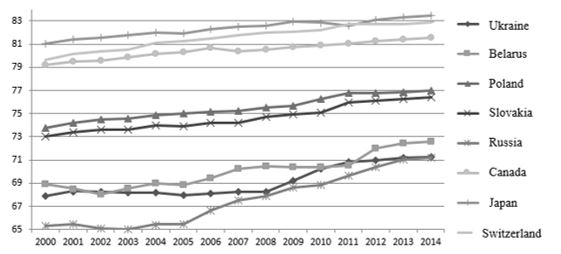
Fig. 2. The dynamics of life expectancy in the countries for the 2000-2014 years
*Source: developed by the author based on [3]
Despite the fact, that North America has the highest life expectancy, among the countries leaders in life expectancy are Japan and Switzerland. It connected with quality conditions of living in the country and, consequently, health of residents, particularly in Japan and Switzerland there are quite small number of people with heart disease and people suffering from obesity, which is not true of people in North America.
Compared to developed countries, where life expectancy is the highest, today life expectancy in Ukraine is quite low (71 year). Even if do not compare Ukraine with Switzerland, Japan, Canada, and only with neighboring countries, such as Poland, Belarus, Slovakia, life expectancy in Ukraine is the lowest.
Only in comparison with Russia, life expectancy in Ukraine was higher during 2000-2007, but in 2007, the countries have almost the same life expectancy.
The reason for the low life expectancy compared to neighboring countries may be the economic situation, such as income level and ensure government health spending, business activity and, consequently, emissions of harmful substances, no vaccinations against viral diseases, lack availability of public hospitals and so on. Therefore, in the model it is important to study the impact of social, biological and other factors in life that are important for countries that are both on different continents parts of the world, and have their own living conditions.
In constructing multi-regression model, first and most important step is the selection factors that affect life expectancy. Based on the analyzed studies, we selected factors that can affect life expectancy:
- Environmental pollution. Environmental pollution is generally estimated emissions of carbon dioxide generated by burning fossil fuels and cement production. The indicator is high in countries, where industry dominates, and it probably affect the health and thereby reduce life expectancy. However, Tomi Smith study shows that environmental pollution does not affect life expectancy [8].
- Sanitary conditions. Sanitary conditions are usually evaluated improved sanitation. Factor indicates the possibility of maintaining health by improving sanitation and reflects the share of the population with access. Since sanitation is one of the ways to improve health, so it is likely, that life expectancy is also dependent on it. The scientists who conducted the research in Latin America showed that factor affects life expectancy [7].
- The urban population. The indicator typically describes the number of urban residents. The population in the city has more harmful effects on health than in the countryside, because we believe this is relevant and the more urban population are in the country, so the lower is life expectancy. Nevertheless, Tomi Smith proved the opposite, that the proportion of the urban population does not affect life expectancy [8].
- Revenue rated at the GDP per capita, shows the average number of products per person. As life expectancy in some way, dependents on income, such as quality of life, access to private and better medicine, etc., so it is important to include an indicator in the study. C. Schnabel and P. Ellis showed that income affects life expectancy [4].
- The level of health protection. Index estimated the cost of health care. Health care costs cover the provision of medical services, food, emergency assistance, but does not include sanitation as an important indicator, because health is the basis of life expectancy and its support is important not only from the side of human, but from the side state. Tomi Smith confirmed that the level of health care is irrelevant to life expectancy [8].
- The presence of conflicts (wars). Indicator describes conflicts. Today, in many countries there is the emergence of armed conflict or war continued over the years. Consequently, life expectancy could decline by as dead during the war and through socio-economic conditions that occur during military conflicts.
Many researchers, including Andre Mozar, Carrie Clough-Horr and Marcel Zvahlen used models of linear regression for modeling life expectancy in Switzerland [5]. Ntamyoken A., S. Haberman and D. Konsihli used cointegration approach for modelling life expectancy [4]. We used multifactor regression model based on panel data.
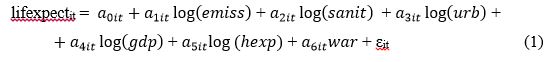
Therefore, life expectancy model includes six factors:
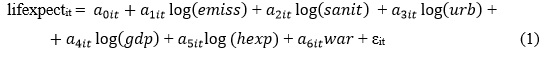
where a0,…,a6 – parameters of equation, than need to be measured;
lifexpect – life expectancy in years;
emiss – output of carbon dioxide in tonnes per capita;
sanit – Improved sanitation in % of the population that have access;
urb – urban population in % of total;
gdp – GDP per capita in USA dollars;
hexp – health expenditure per capita, USA dollars;
war – the presence or absence of armed conflict;
εi – not included residues in the model of life expectancy, ε ~ N( µ, σ2).
Sampling for construction of model life expectancy are data of 162 countries and from 2000 to 2014, data taken from the site of the World Bank. A brief summary of the whole sample and the observation shows descriptive statistics.
Table 1
Descriptive statistics of factors
| Factor | Mean | Standard deviation | Minimum | Maximum |
| lifexpect | 68,74 | 9,76 | 38,11 | 83,47 |
| log(emiss) | 4,70 | 6,72 | 0,02 | 61,99 |
| log(sanit) | 4,08 | 0,66 | 1,89 | 4,61 |
| log(urb) | 3,89 | 0,53 | 2,11 | 4,61 |
| log(gdp) | 8,19 | 1,60 | 4,66 | 12,53 |
| log(hexp) | 5,36 | 1,74 | 1,50 | 9,22 |
| war | 0,07 | 0,25 | 0 | 1 |
We normalized data, as seen from the table. 1, which confirms the coefficient of variation, that is lower than 0.33, except for the variable output of carbon dioxide, which varies on the big gap, but the exclusion of the lowest or highest output of carbon dioxide could lead to the exclusion of important countries of the models and reduce sample which can lead to inadequate model.
As the model of life expectancy is based on panel data, so the evaluation of models for implementation need to choose between a through regression and model with random effects (Broysh-Padzhan test), through regression and model with fixed effects (Wald test) and between the model with random effects model and fixed effects (Hausman test) [2]. Based on the tests we have chosen the model with fixed effects.
The estimated life expectancy model is:
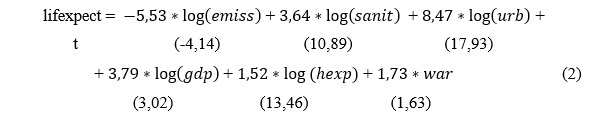
Our study showed that a model has high explanatory power (R2=0.7061) and adequately reflects the impact of the factors on life expectancy (Fstat= 474.25).
With a significance level of 1% at reducing carbon dioxide emissions by 1%, life expectancy will increase by 0.06 years. With a significance level of 1% with an increase of improved sanitation by 1%, life expectancy will increase by 0.04 years. With a significance level of 1% with an increase of the number of urban population by 1%, life expectancy will increase by 0.08 years. With a significance level of 5% with an increase in income by 1%, life expectancy will increase by 0.03 years. With a significance level of 1% with an increase in health care costs by 1%, life expectancy will increase by 0.02 years. With a significance level of 10% in the presence of military conflict in the country, life expectancy will increase by 0.02 years.
As seen from the model, all parameters statistically significantly different from zero, so all these factors (but not the war) affect life expectancy.
Factor of health as model proved has the highest t-statistics, and therefore has the greatest value for a lifetime. In this context, we have identified several issues that may affect the rate. In particular, we are interested in problems that arise in the Ukraine.
One of these problems, which can cause different effects of selected factors on the sign, is tuberculosis. To show the impact indicators for life expectancy, depending on the level of tuberculosis in countries we selected a sample quartile of countries with the lowest level of tuberculosis (3) and the quartile with the highest values of tuberculosis (4). Accordingly received two regression equations:
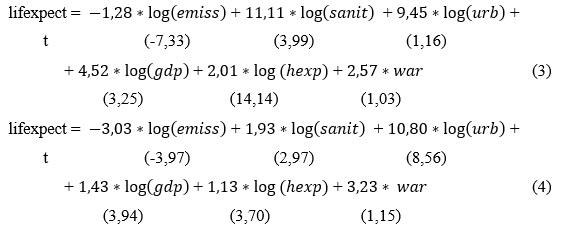
The model, which takes into account countries with low tuberculosis (3) factors that exert the greatest influence, is environmental pollution, sanitation, income and standard of health. Accordingly, in countries where are high levels of tuberculosis (4), together with the above factors in the expected level of life expectancy affects the urban population. However, Ukraine is among the countries where high levels of of tuberculosis, so to reduce tuberculosis is necessary to reduce environmental pollution and to pay attention to the urban population (4).
Another problem that can significantly reduce life expectancy is the mortality of children under 5 years. Therefore, in order to show the impact indicators based on mortality among children under 5 years, we selected quartile values, including the low number of deaths of children under 5, and quartile in which high figure. The result is two regression equations:
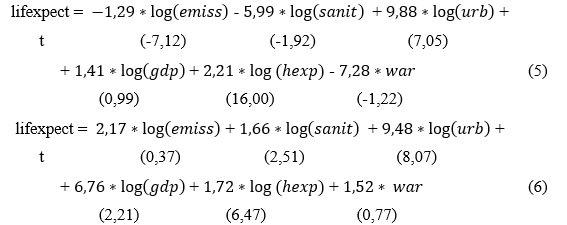
As we can seen, the model, which includes countries with low child mortality under 5 years (5) factors that exert the greatest impact, is environmental pollution health standards, the urban population and the level of health care. However, those in countries where high child mortality rates under 5 (6), indicators are slightly different. It also applies to Ukraine. Therefore, to reduce child mortality under 5 years need to pay attention to the environmental situation and the level of income.
An important problem that can occur at high tuberculosis and child mortality under 5 years is immunization. Index indicates the use of a variety of antiviral vaccines, vaccination to prevent other illnesses and so on. Because of the lack of insufficient vaccination, number of diseases raises and it may reduce life expectancy.
Therefore, in order to show the effect of immunization, we selected high quartile of immunization in the countries (7) and quartile with low immunization (8). Models are:
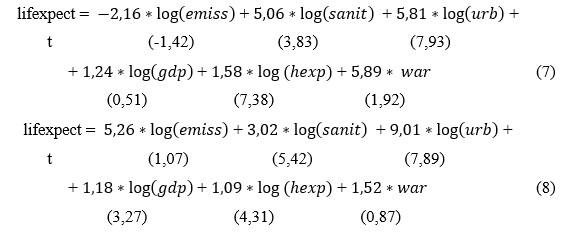
So, as we see, in countries with high levels of immunization (8), affecting health standards, the urban population, the level of health care and the availability of military conflicts. In countries with low immunization (7), which includes Ukraine, the important role played by the same factors but income levels affect life expectancy, and the presence of military conflicts are not affected.
Conclusion. The problems of the presence of high levels tuberculosis in countries shows that for lowering these factors need pay attention to the urban population. However, the problem of mortality of children under 5 years shows that to reduce this indicator we should pay attention to the problem of income. The problem of immunization that may cause the other two mentioned above problems proved that for increasing we should pay attention to the income.
Therefore, we have proved that the increase of life expectancy is possible by reducing environmental pollution, improving sanitation, increasing the share of urban population, increasing incomes, and improving health. Moreover, in the case of Ukraine should pay attention to the level of income in the country and the urban population.
Literature
- Adaptatatsiya modyfikovanoyi modeli Brassa dlya pobudovy povnykh tablyts smertnosti naselennya Ukrainy/ A. I. Stefanovskyi // Demographia and socialna economika. — — № 2. — P. 38-55. — Ref .: 3 titles. — ukr.
- Ratnikova T. A Analys panelnykh dannykh v pakete «STATA» [Electronic resource] / T. A. Ratnikova// Hosudarstbennyi Universitet. Vysshaya shcola economyky. — 2004. — Mode of access: https://pokrovka11.files.wordpress.com/2011/09/d0bcd0b0d182d0b5d180d0b8d0b0d0bbd18b-d0ba-d0bad0bed0bcd0bf-d0bfd180d0b0d0bad182d0b8d0bad183d0bcd183-rukovodstvo.pdf.
- World Bank [Electronic resource] // THE WORLD BANK: [site]. — Mode of access: http://www.worldbank.org.
- Lee-Carter mortality forecasting: a parallel generalized linear modelling approach for England and Wales mortality projections [Electronic resource] // Arthur Renshaw and Steven Haberman. — 2003. — Mode of access: http://cassknowledge.co.uk/sites/default/files/article-attachments/402~~stevenhaberman_lee-carter_mortality_forecasting_-_2003.pdf.
- Modeling absolute differences in life expectancy with a censored skew-normal regression approach [Electronic resource] // Andre Moser, Kerri Clough-Gorr and Marcel Zwahlen, for the SNC study group. — 2008. — Mode of access: https://peerj.com/articles/1162.pdf.
- Sabine K. Schnabel. An analysis of life expectancy and economic production using expectile frontier zones [Electronic resource] / Sabine K. Schnabel, Paul H.C. Eilers // VOLUME 21, ARTICLE 5, PAGES 109-134. — 2009. — Mode of access: http://www.demographic-research.org/volumes/vol21/5/21-5.pdf.
- Social determinants and inequalities in tuberculosis incidence in Latin America and the Caribbean [Electronic resource] / César V. Munayco, Oscar J. Mújica, Francisco X. León et al.]. — 2012. — Mode of access: http://www.scielosp.org/pdf/rpsp/v38n3/v38n3a01.pdf.
- Tony S. A statistical analysis of life expectancy across countries using multiple regression [Electronic resource] / Smith Tony // Sys 302 Project — Mode of access: http://www.seas.upenn.edu/~ese302/Projects/Project_2 .pdf.
- Understanding the Lee-Carter Mortality Forecasting Method [Electronic resource] // Federico Girosi and Gary King. — 2007. — Mode of access: http://gking.harvard.edu/files/lc.pdf.